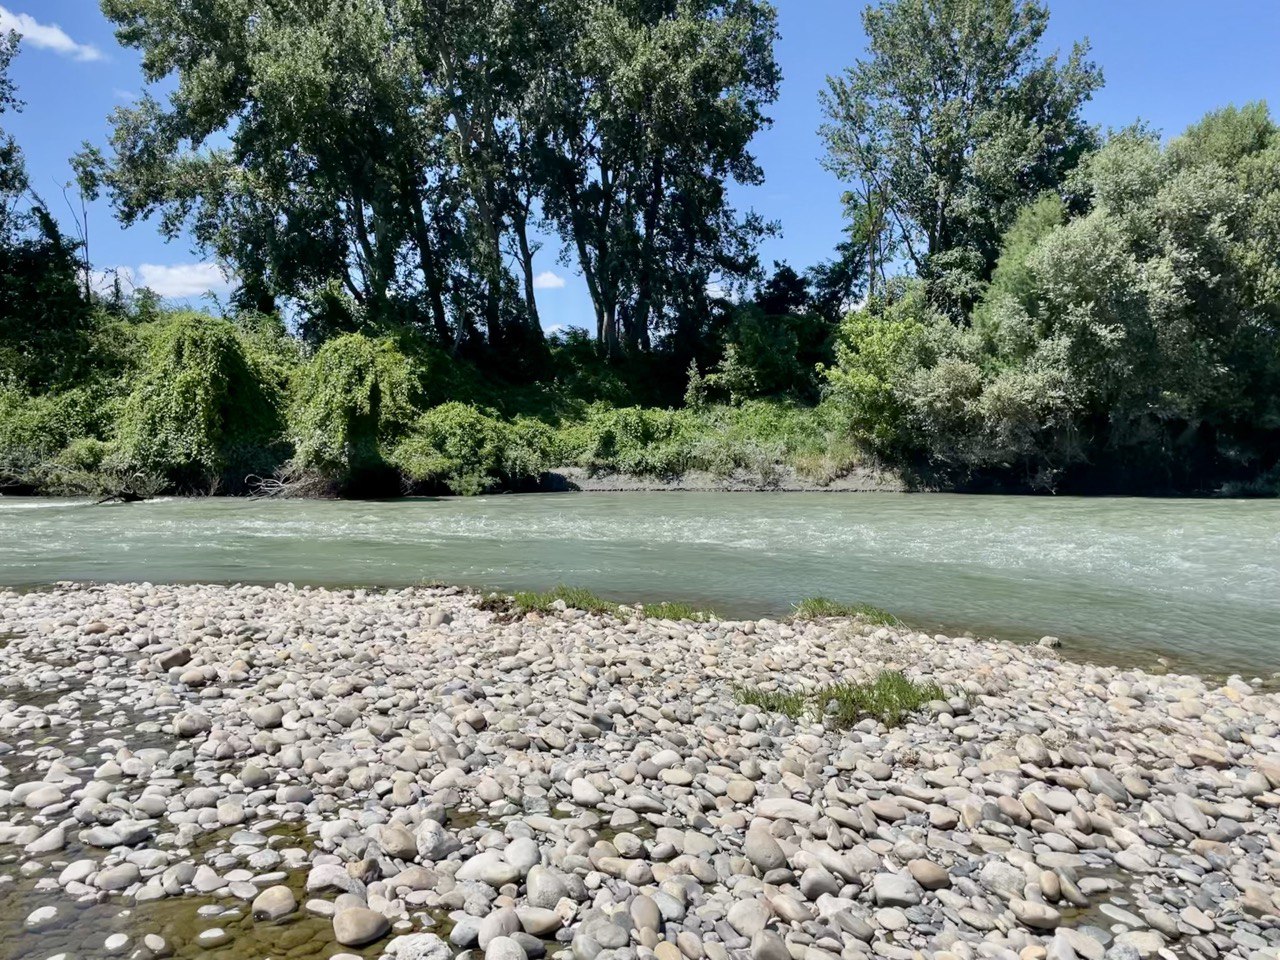
How are sediment bars and banks distributed in our rivers and how does their area change over time and space? This question may not be widely considered, yet it is a topic worthy of further investigation. Most intact river systems are composed of a highly dynamic landscape within which sediment bars are key features. They are highly versatile with regard to water access and temperature, providing rich and diverse habitats and space for interactions among aquatic, avian, and terrestrial species, as well as important pathways of material exchange between terrestrial and aquatic systems (Hauer et al. 2016). A reduction in the extent of these features may indicate a atleration of the river system. For instance, the construction of dams and the implementation of channelisation measures can result in a constant inundation or plant overgrowth of fluvial sediments, thereby leading to a river landscape that is more stabilised and less habitat-rich. It is therefore crucial to gain a comprehensive understanding of the geographical distribution of these sedimentary features and to monitor their changes over time and across space.
In the new category “Paper of the Week”, I would like to introduce today the work of Patrice Carbonneau and Simone Bizzi. In their paper published this year (2024), they present an extraordinary analysis workflow applying state-of-the-art deep learning algorithms on satellite imagery to investigate the distribution of gravel bars in the global river network. Despite the technical nature of the work due to its promising methodological advancements, the results are just as interesting.
In terms of methodology, they utilised satellite imagery of an extent of 89 % of the worlds surface, sourced from the Sentinel-2 Satellite mission with a resolution of 10 meters. downloaded from Google Earth Engine and aggregated over one month (July 2021). Obtained from Google Earth Engine, the data was aggregated over a period of one month (July 2021). A fully convolutional neural network (FCNN) called Tiramisu, developed by Jégou et al. (2017), was applied to the dataset. This type of deep learning architecture is capable of pixel-level semantic class predictions. Each pixel was classified by the model with the following classifications:
- noise ( background)
- river
- lakes
- fluvial sediment deposits
- ocean
- glaciers
- snow
- clouds
The model was trained in two steps, first with a large dataset of automatic classifications from ESRI 2020 land-cover data, and then in a second step with manually classified images.
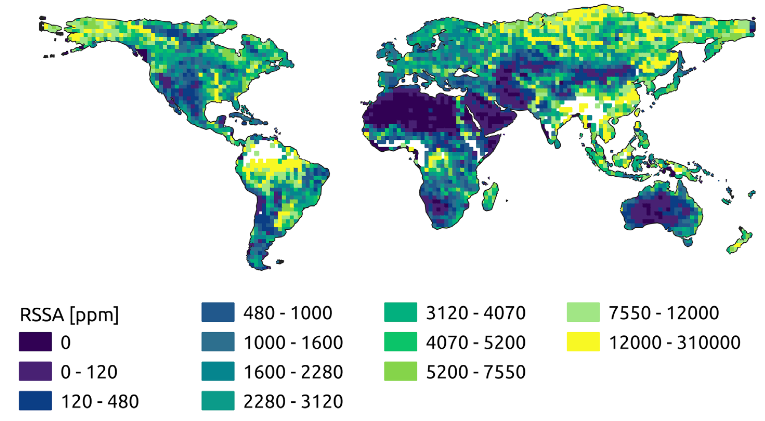
Their results show the relative area of rivers in the world (River and Stream Surface Area - RSSA), highlighting the regions with large shares of river surface area in Siberia and Alaska or in South-East Asia, but also in major basins such as the Amazon, Congo, Mississippi, Brahmaputra-Ganges and the Nile. By contrast, very few river area covered by rivers can be found in North and South-west Africa, the Middle East, Central- and West-Asia, as well as Australia.
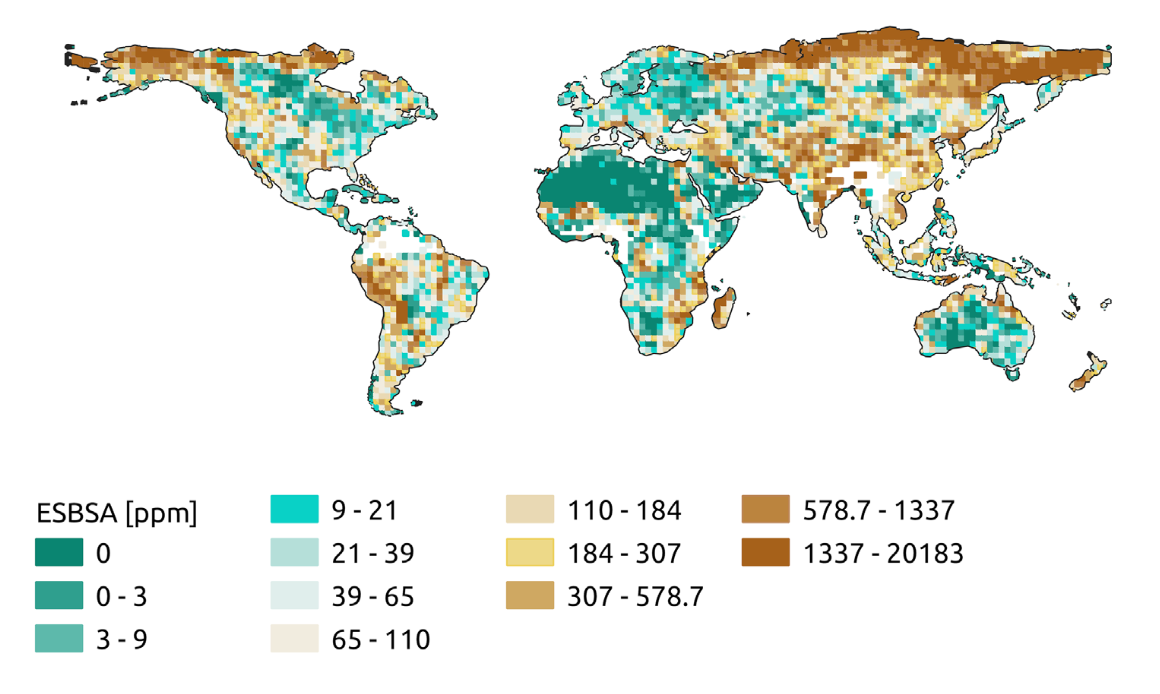
The Exposed Sediment Bar Surface Area (ESBSA) coincides mostly with the RSSA. Regions with the highest density of sediment bars are Siberia and Northern Russia with sediment produced in the Siberian uplands, Alaska with sediment sourced in the Brooks and Alaska mountain ranges, and the Nunavut region in Canada which is likely sourced in the Arctic cordillera mountains. In South America, the south-western foothills of the Andes show highest densities, transporting sediment to the Pacific Ocean. In Africa, highest gravel-densities can be found around the Licungo and Zambezi rivers debouching into the Mozambique channel, opposed by high sediment density rivers in Madagascar. Last, in Asia the highest concentrations of gravels can be found in rivers draining the Himalayas.
In conclusion, Carbonneau and Bizzi present not only the first global study to quantify the area of sediment bars, but furthermore they are the first to apply FCNN on a nearly-global extent of satellite imagery to identify river systems and their key features and distinguish them from standing waters. The work showcases the potential of deep learning applied to global scale studies of fluvial systems, paving the way for future studies. As the analysis is conductible within 4 weeks of computation time, it could be used to constantly measure the location and concentration of sediments bars in the global river network each month, which would provide valuable insights into its change over time and space.
Links
You can find the whole article here:
Carbonneau, Patrice E., and Simone Bizzi. “Global Mapping of River Sediment Bars.” Earth Surface Processes and Landforms 49, no. 1 (2024): 15–23. https://doi.org/10.1002/esp.5739.
If you want to read more about the ecological significance of sediment bars I recommend:
Hauer, F. Richard, Harvey Locke, Victoria J. Dreitz, Mark Hebblewhite, Winsor H. Lowe, Clint C. Muhlfeld, Cara R. Nelson, Michael F. Proctor, and Stewart B. Rood. “Gravel-Bed River Floodplains Are the Ecological Nexus of Glaciated Mountain Landscapes.” Science Advances 2, no. 6 (June 24, 2016): e1600026. https://doi.org/10.1126/sciadv.1600026.
And if you want to learn more about the fully convolutional neural network Tiramisu, take a look at:
Jégou, Simon, Michal Drozdzal, David Vazquez, Adriana Romero, and Yoshua Bengio. “The One Hundred Layers Tiramisu: Fully Convolutional DenseNets for Semantic Segmentation.” In 2017 IEEE Conference on Computer Vision and Pattern Recognition Workshops (CVPRW), 1175–83, 2017. https://doi.org/10.1109/CVPRW.2017.156.